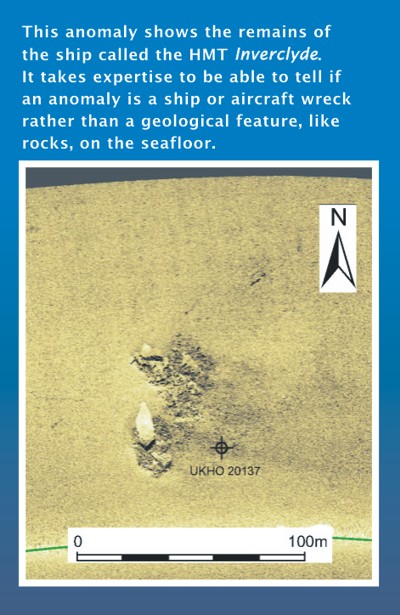
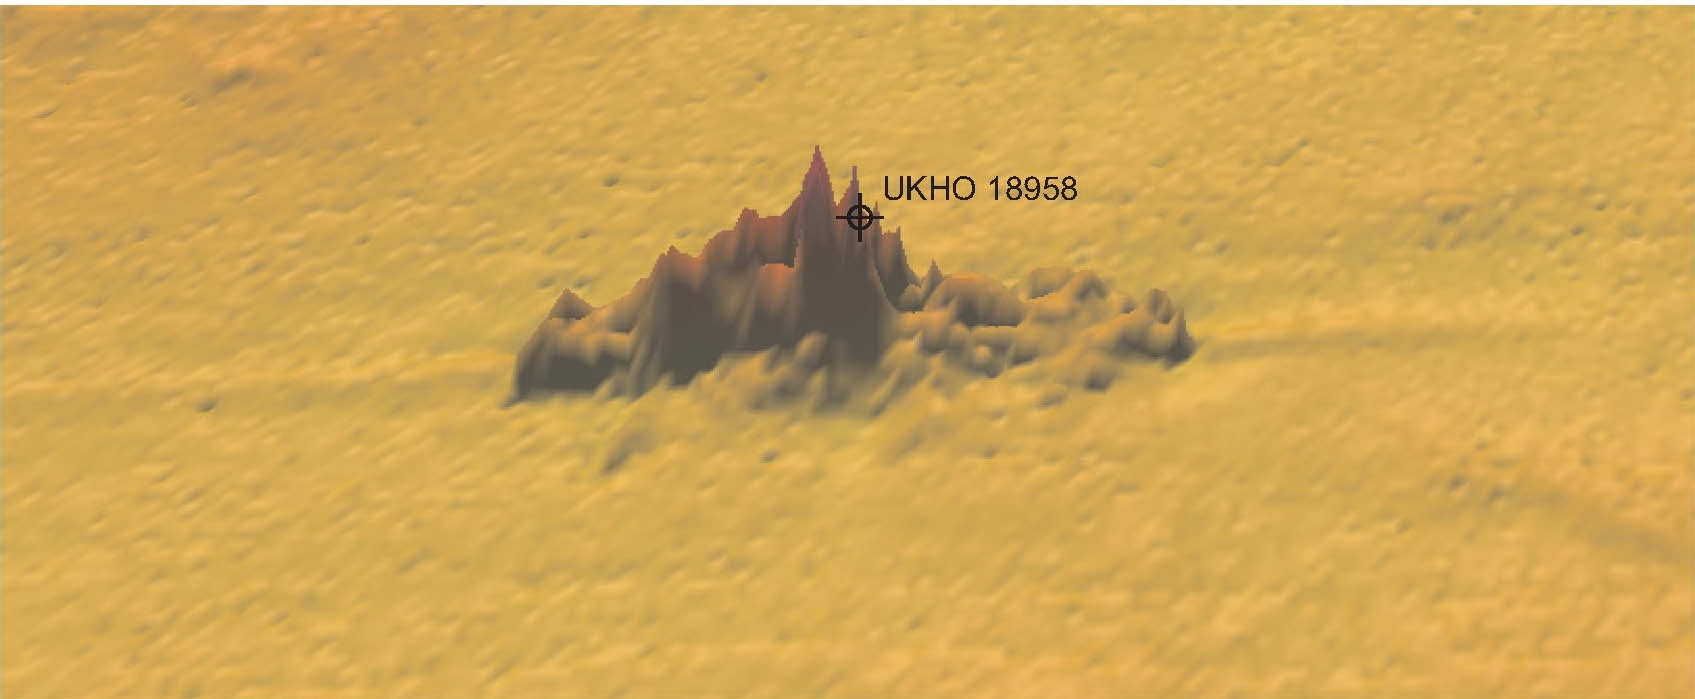
Geophysical survey involves ways of mapping what is on and below the seafloor. This was a key element of all four RECs.

Using all types of geophysical survey data collected over time we can create maps of what the seafloor looks like
Marine geophysicists undertake a variety of geophysical survey techniques to provide different information about the physical environment of the seafloor. They can work with and for archaeologists and geologists, as this work is essential to each of these areas’ day-to-day research.
For each survey technique the boat travels along survey lines set out across the REC study area. The survey cannot cover the entire area of each REC. It relies on collecting data for a proportionate representation of the area.
As well as new survey data, the RECs used previously collected data. Seazone, a marine data company, supplied the majority of this information, amalgamated from years of previous geophysical survey undertaken for a variety of reasons by a variety of organisations and companies. They provided an overall bathymetric map of each survey area. This map provided a foundation for the REC, helping scientists plan where to survey in more detail.
Combining all this data, and using modelling, allows each REC study to produce an overall assessment of the physical environment for the whole of the study area.
Each of the four REC studies is unique and the geophysical survey was adapted depending on the local environment and the research questions that are being asked. Whilst all four REC studies used the same key methods, they may have used them in slightly different ways.
You can find out more about the results that the scientists produced in the general REC webpages.
Here are the principal techniques used. Click on the links to visit sections, or scroll down to read the whole page.
Sidescan sonar
Sidescan sonar uses a sonar device called a “tow-fish” to record images of the seafloor.
 The tow-fish is towed behind the boat. It emits regular soundwaves from transducers on the side of the tow-fish, hence the name sidescan. These pulses are reflected back to the tow-fish when they encounter an obstruction in their path, for example the seafloor or a shipwreck.
The intensity of the reflection is recorded and this can illustrate characteristics of the seafloor. A colour-graded image displays the results, with changes in the shade of the colour indicating the varying intensity of the reflection. Areas of no return, where there is no reflection, are shown as shadows, which help us understand the images i.e. where something rises up from the seafloor.
The different scientists working on the REC can use these images to help them understand the physical environment of the seafloor. So, for example, geologists use this method to identify seafloor sediment types. Fine sediments such as muds and silts will often absorb the sound, so the intensity of the soundwave reflection is low and on the image the area appears darker. Harder sediments such as coarse gravels or bedrock will reflect the sound back, so the intensity of the reflection is strong and so appear lighter in shade.
The quality or detail of the image depends on the frequency, which is how many soundwaves are sent per second. However, high frequency soundwaves can only travel a short distance, while low frequency can travel further but produce lower resolution images.
Sidescan produces a flat image, it does not measure the depth of the seafloor, for this scientists use other techniques.
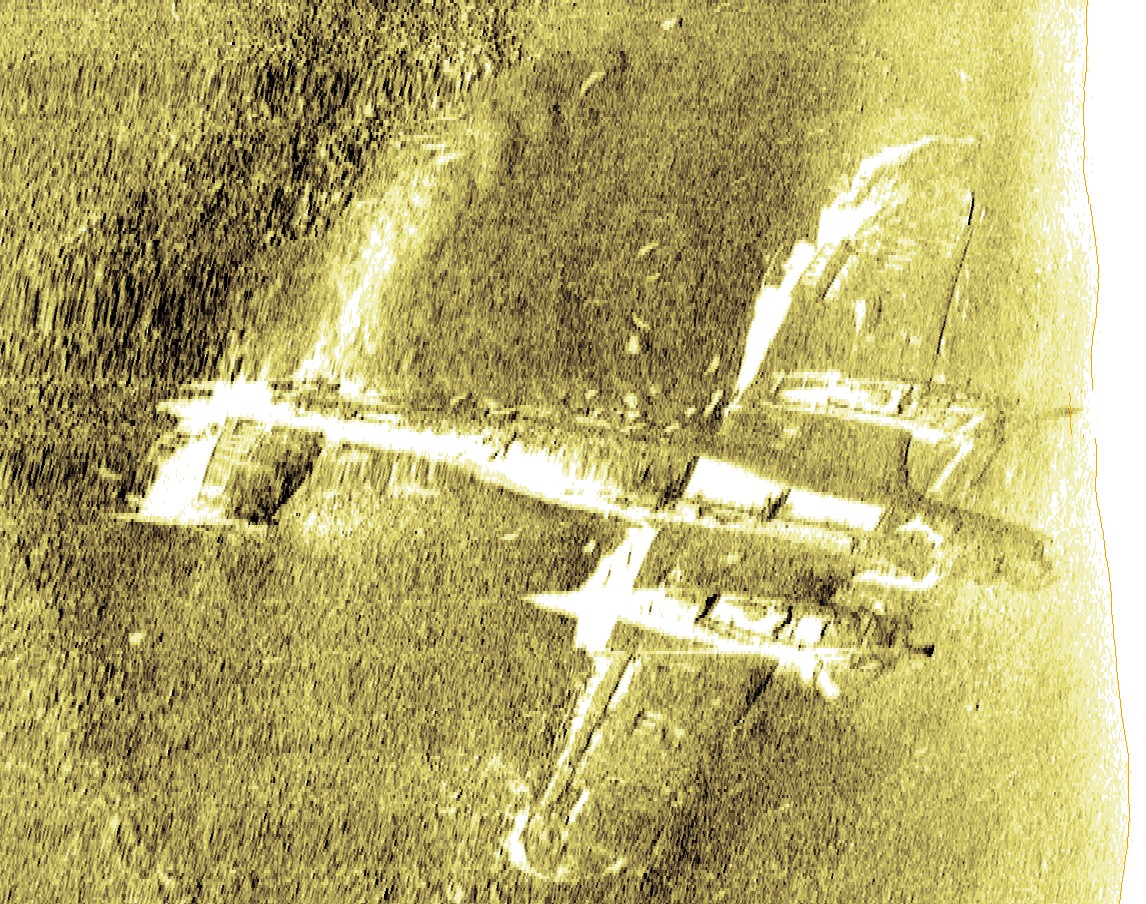
Dornier 17 Bomber: This is the result of a detailed sidescan survey, it is rare that a sidescan image is this clear.
Multibeam Bathymetry
Multibeam sounders collect data that allows scientists to make 3-Dimensional images of the seafloor.
 Multibeam sonar is called a variety of names: swathe, swath or echosounders.
The geophysical survey technique uses a transducer that is located underneath the boat. Similarly to the sidescan, it emits regular soundwaves from the transducer, which are reflected back when they encounter an obstruction in their path.
However instead of measuring the intensity of the returned reflection, it measures the time it takes for the pulse to travel to the obstruction and return.
By doing this scientists can calculate the depths of the seafloor. This allows scientists to produce bathymetric images, recording the contours or terrain of the seafloor. It is not a flat image.
A computer on board the boat processes the returning signal. Each survey line that the boat navigates collects a corridor of data known as a swath.
Back in the laboratory the data is processed. This involves filtering out any interference from the images and checking other information that could affect the results, for example the daily tides. The results provide not only 2D but 3D representations of the seafloor. This information helped map what the seafloor looks like.
Sub-bottom Profiler
Sub-bottom profiling does not map the seafloor but rather records a section of the layers below the surface.
 This technique has several names including “boomer”. The device is either mounted on the boat or towed behind. It uses sound pulses to penetrate the seafloor and make an image of the geological layers beneath it. As the sound waves travel through the ground, they are reflected back when a change in the geology occurs. These reflections are called “horizons”, which can be mapped across the study area.
A horizon can be a change in the seafloor sediment type, for example between a layer of rock and a layer of sand. It can also show where there is a major change in angle and character of deposits, for example where there is a cut of an ancient river channel, which has been infilled by mud and sands.
The results produce profiles of the seafloor that can help geologists and archaeologists understand how the seafloor formed over time and reconstruct ancient landscapes. For example, they can map buried river channels that formed a long time ago and then filled up with seafloor sediment, revealed in profile by the geophysical survey.
Similarly to sidescan, the frequency of the soundwave affects the detail of the information. High frequency provides a detailed high-resolution image of the changes in the seafloor but cannot travel as deep underground as low frequency, which produces less detailed, lower resolution images.
As it takes vertical images, rather than images of the surface, marine geophysicists must carefully select where to use this technique to get the best information they can.
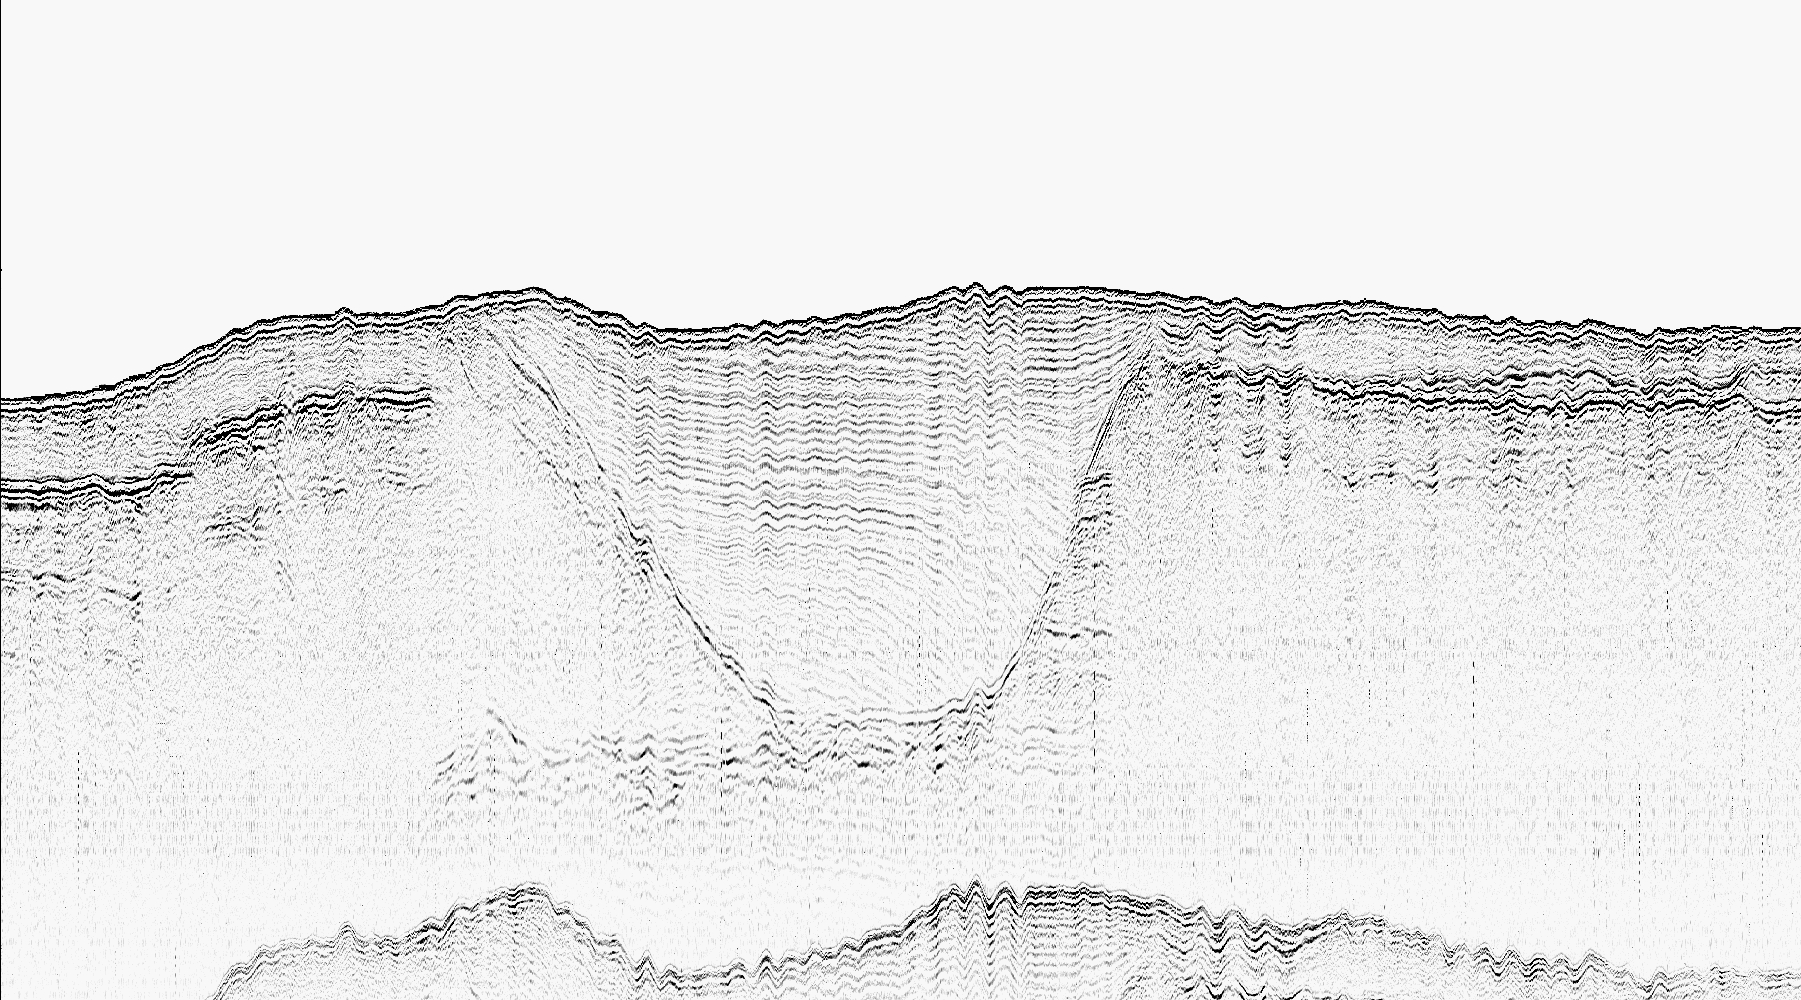
This is a profile of a buried river channel that ran across a REC study area when it was dry land, but has infilled with seafloor sediments.
 Marine Magnetometry
Marine magnetometry is different from the previous techniques. It does not use soundwaves but detects variations in the Earth’s total magnetic field.
The variations in the magnetic field are caused by the presence of ferrous (iron) material on or under the seafloor. Marine magnetic surveying has become a standard technique for mapping the location of ferrous material on the seabed. In particular it is used by archaeologists to detect ship and aircraft wrecks.
The equipment needs to be towed behind the boat at a sufficient distance to avoid any magnetic disturbance caused by the boat itself. The data collected is combined and displayed in different ways. In the line graph below, the rise in readings indicates the location of a metal wreck.

World War One SS Mendi: A graph like this is one of the ways to record magnetometry data. The rise in the graph indicates the presence of a metal shipwreck.

